cherab.phix.observer.fast_camera.plot_RGB_filter#
- cherab.phix.observer.fast_camera.plot_RGB_filter(wavelengths=None, fig=None, ax=None)#
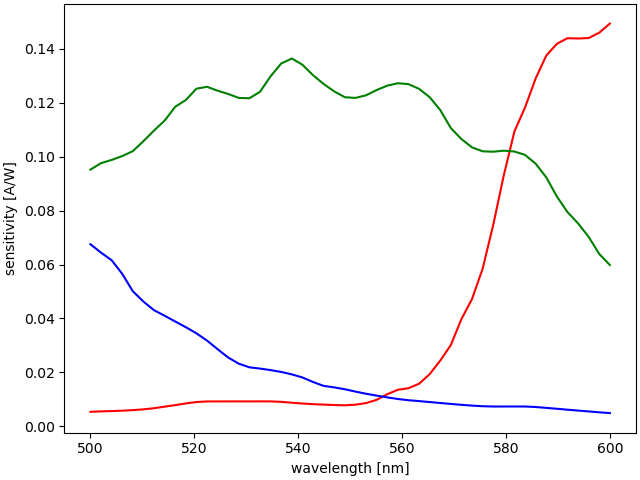
Plot interpolated RGB sensitivity curves of Phantom LAB 110 camera.
This plot handles 1-D interpolated sensitivity data which is used to filter the light through the pipeline.
- Parameters:
wavelengths (1D vector-like, optional) – sampling points of wavelength, by default 500 points in range of (380, 780) [nm]
fig (Figure | None) – matplotlib figure object
ax (Axes | None) – matplotlib axes object
- Returns:
matplotlib figure and axes object
- Return type:
tuple[Figure, Axes]
Examples
import numpy as np wavelengths = np.linspace(400, 600) fig, ax = plot_RGB_filter(wavelengths) fig.show()