Note
This page was generated from docs/notebooks/machine/material_parameter.ipynb.
Material characteristics of PHiX in-vessel components#
Rough Metal#
Rough metal material have complex refractive index:
\[n^* = n + ik.\]
Here, the real part \(n\) is the refractive index, while the imaginary part \(k\) is called the extinction or absorption coefficient. We show their parameters in range of visible light wavelengths.
[1]:
import numpy as np
from matplotlib import pyplot as plt
from raysect.optical.library import Aluminium

from cherab.phix.machine.material import PCTFE, SUS316L

plt.rcParams["font.size"] = 12
plt.rcParams["figure.dpi"] = 150


aluminium = Aluminium()
sus316l = SUS316L()
teflon = PCTFE()
[2]:
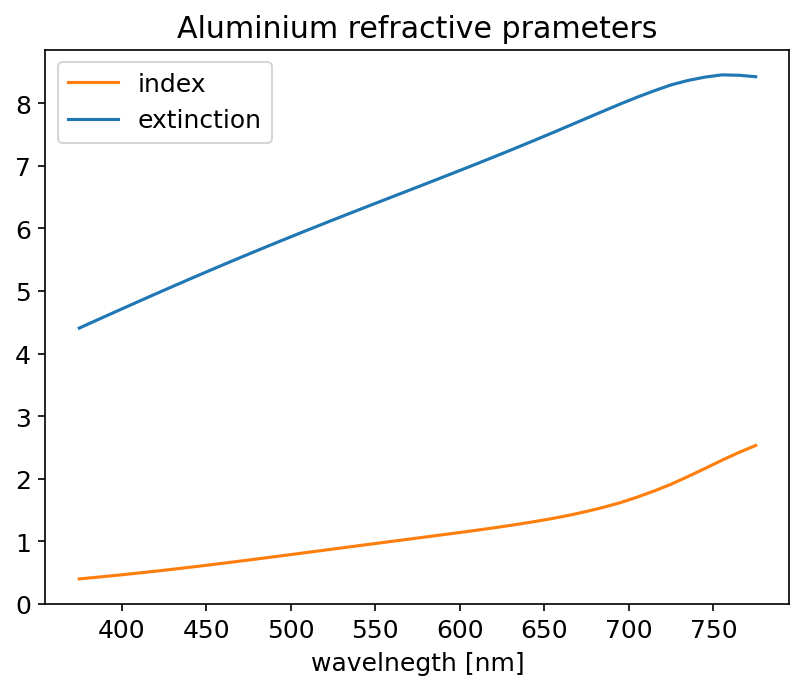
# plot index & extinction of each materials
wavelength = np.arange(375, 780, 10)
plt.plot(wavelength, [aluminium.index(x) for x in wavelength], label="index", color="C1")
plt.plot(
    wavelength,
    [aluminium.extinction(x) for x in wavelength],
    label="extinction",
    color="C0",
)
plt.legend()
plt.xlabel("wavelnegth [nm]")
plt.title("Aluminium refractive prameters");
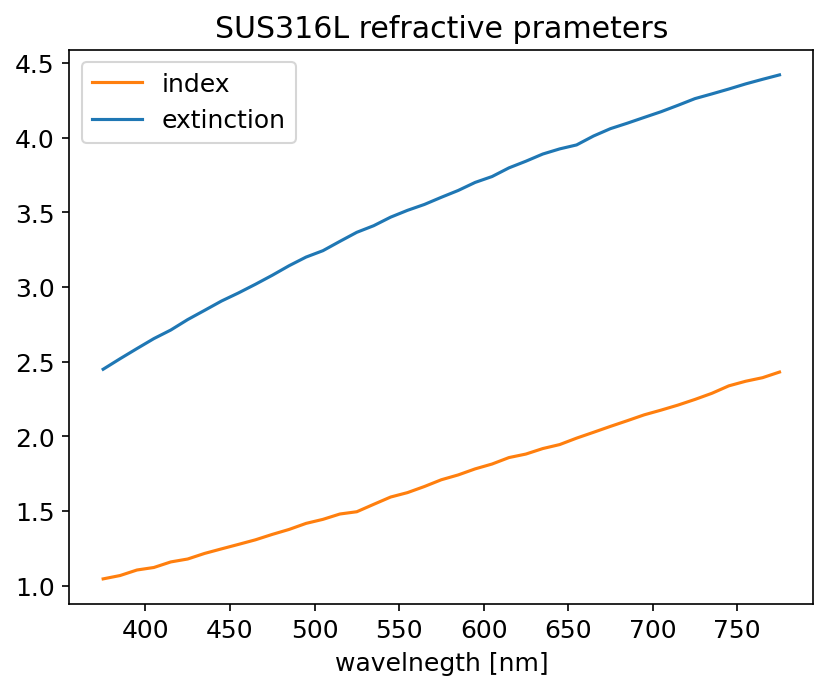
[3]:
plt.plot(wavelength, [sus316l.index(x) for x in wavelength], label="index", color="C1")
plt.plot(
    wavelength,
    [sus316l.extinction(x) for x in wavelength],
    label="extinction",
    color="C0",
)
plt.legend()
plt.xlabel("wavelnegth [nm]")
plt.title("SUS316L refractive prameters");
[4]:
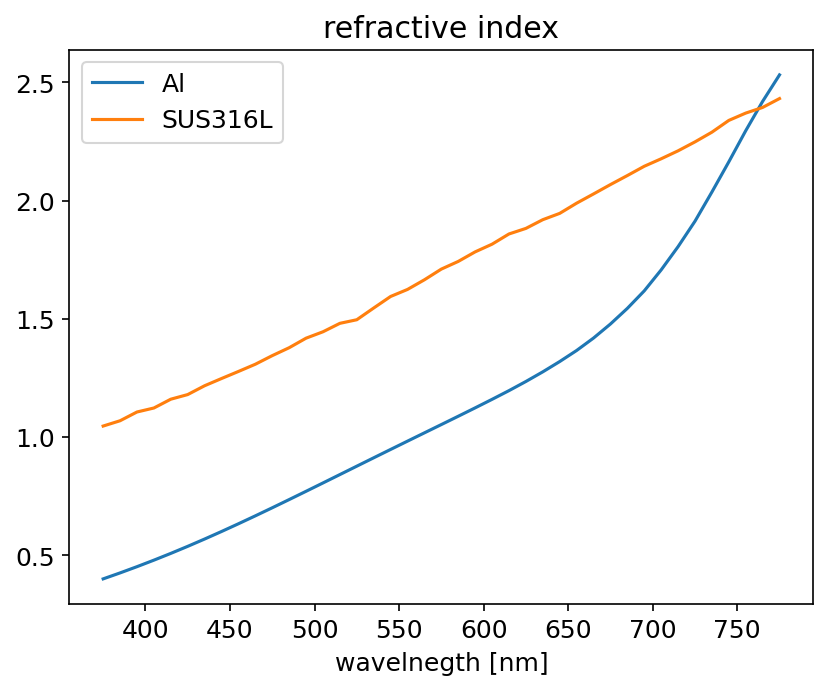
# compared to each of them
plt.plot(wavelength, [aluminium.index(x) for x in wavelength], label="Al")
plt.plot(wavelength, [sus316l.index(x) for x in wavelength], label="SUS316L")
plt.legend()
plt.xlabel("wavelnegth [nm]")
plt.title("refractive index");
[5]:
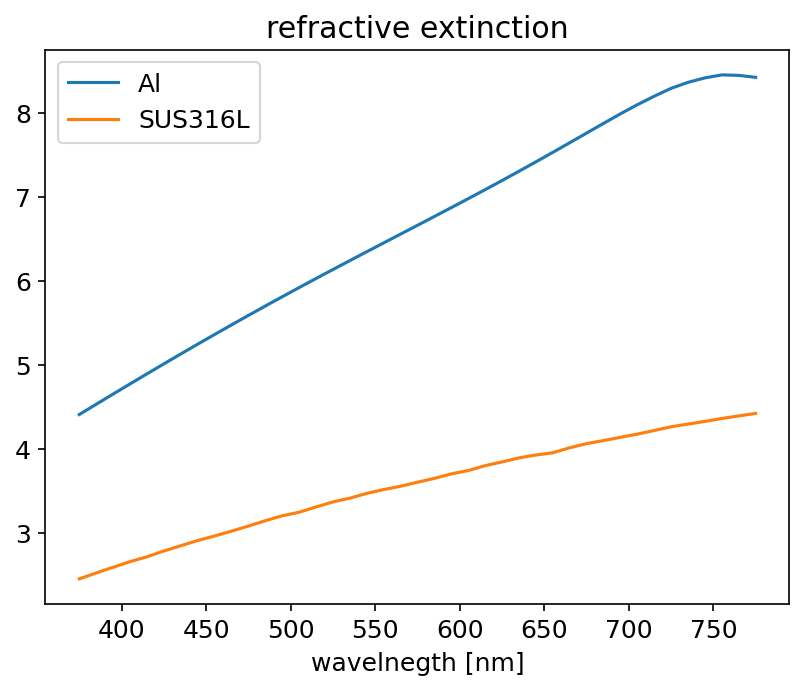
# compared to each of them
plt.plot(wavelength, [aluminium.extinction(x) for x in wavelength], label="Al")
plt.plot(wavelength, [sus316l.extinction(x) for x in wavelength], label="SUS316L")
plt.legend()
plt.xlabel("wavelnegth [nm]")
plt.title("refractive extinction");
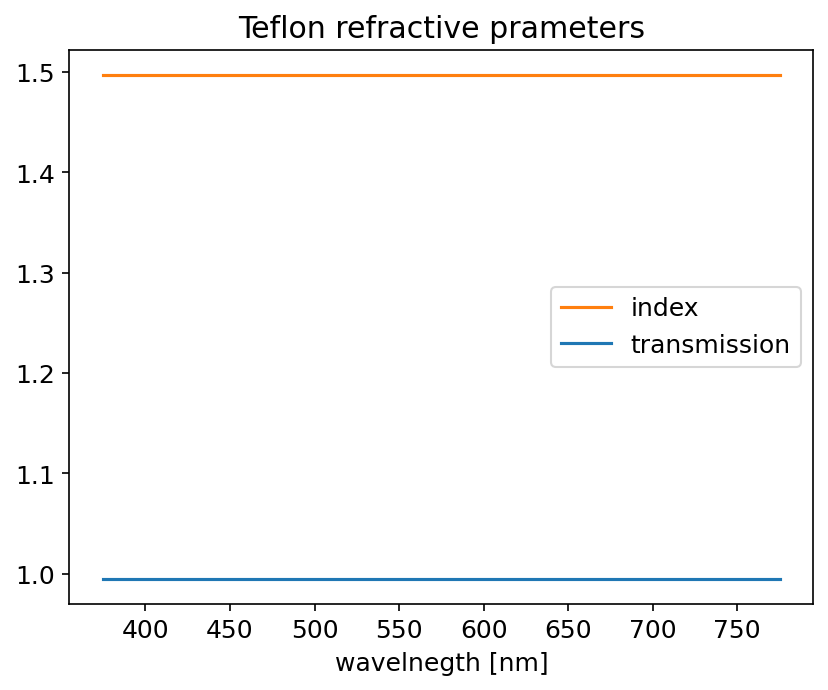
Dielectric material#
Dielectric material have refractive index and transmission. Here, we show the example of teflon (Polychlorotrifluoroethylene)’s parameters.
[6]:
plt.plot(wavelength, [teflon.index(x) for x in wavelength], label="index", color="C1")
plt.plot(
    wavelength,
    [teflon.transmission(x) for x in wavelength],
    label="transmission",
    color="C0",
)
plt.legend()
plt.xlabel("wavelnegth [nm]")
plt.title("Teflon refractive prameters");